STUDY FINDINGS
https://www.youtube.com/watch?v=HsRmj9C2YEM
Critical
Insights
7 critical insights on the path to a
circular and net-zero aligned Norwegian plastic system
Plastics have been a key enabler of growth, efficiency and innovation across all the sectors analysed, utilising ~710,000 tonnes of plastics in Norway in 2021, but this has come at a high environmental cost.
Plastics have played a central role in delivering the goods and services of the seven sectors analysed, providing important benefits by reducing food waste and lowering use phase GHG emissions from vehicles and buildings.
However, a consequence of their use to date is the high GHG emissions caused by the current linear, resource-inefficient plastic system.
As Exhibit 3 shows, the Norwegian plastic system today is 78% linear, relying primarily on fossil-based plastic manufacturing processes and incineration at end-of-life, the most emissions-intensive production and end-of-life routes, together are responsible for 96% of the 2.8 million tonnes of CO2eq generated by the system every year.

This is an inefficient and unnecessary use of both primary resources and Norway’s carbon emissions budget within the Paris Agreement on climate change.
Like many other European countries, in recent years Norway has pivoted away from landfilling waste, and towards incineration with energy recovery, in line with the EU waste hierarchy.
About half of this incineration takes place outside of Norway. As a result, despite renewables now making up 98% of Norway’s electricity generation1, this trend towards a high-emissions form of waste disposal risks undermining Norway’s leadership in the low-emissions electricity generation space by increasing the carbon intensity of its grid.
Combined with a heavy reliance on virgin fossil-based plastic production, due to the low uptake of recycled content both within Norway and in the wider region, this has led to a GHG intensive system. The plastic value chain in scope is today responsible for ~7% of Norway’s total annual GHG emissionsd.2
d Note that this is the total GHG emissions associated with plastic consumption in Norway, including from production outside of Norway to meet Norwegian demand, as well as from waste management outside of Norway as a result of waste exports.
EXHIBIT 3
Only 22% of waste from these 7 sectors is currently being circulated back into the system, with incineration being the most common end destination for plastic today.
Baseline Scenario 2020 – Kt / t CO2eq

Source: Mepex analysis
While plastic pollution in Norway is much lower compared to less developed markets, and Norway has taken significant strides to minimise it, domestic plastic pollution has not been eradicated. It is estimated that 10,000 tonnese (2%) of the plastic waste produced annually in Norway leaked into nature in 2020, the majority of which in the form of plastic packaging (~5,000 tonnes), Waste from Electrical and Electronic Equipment (WEEE)f (~4,000 tonnes), and fishing gear (~1,000 tonnes).
While not a focus of this study, in addition to the harmful impacts on the environment and natural habitats, plastic pollution is causing concerns among health experts due to the potential impacts on human health, including disruption to cellular activity.3
e This is a highly uncertain and much debated figure, particularly for leakage of fishing gear. In Norway, most of the leakage from fishing gear are small low weight items like rope cuts, as the majority of large gear is recovered.
f Note that for WEEE this refers only to large industrial cables being left underground.
The situation is worsening as the current trajectory of the Norwegian plastic system is fundamentally misaligned with national circularity ambitions and key climate targets, with a 57% increase in waste generation and a 21% increase in GHG emissions (to 3.4 million tonnes of CO₂eq) projected by 2040.
Plastic usage across consumable and durable applications is set to increase by 28% and 38%, respectively, by 2040 relative to 2020, representing a 34% growth in overall plastic demand. At the same time, waste generation across these applications is set to grow by 28% and 113%, respectively, representing a 57% overall growth by 2040.
This rapid increase in plastic consumption and waste generation will intensify today’s already severe challenges of high emissions, resource inefficiency, and pollution.
The challenges faced by consumable applications are quite distinct from those faced by durable applications. Consumables are generally a more resource-intensive use of plastic, as the economic value is lost after just one short use cycle spanning less than a year. These applications of plastic – i.e., packaging and household goods – also contribute most to pollution, emissions, and system linearity.
Durables are a much more efficient and effective use of plastic as they keep the material in the economy for several years. However, their use across a wide variety of sectors and applications has led to a large accumulation of in-use stock, estimated at 4.9 million tonnes in 2021 and set to grow to 8.3 million tonnes by 2040, which the existing waste management infrastructure in Norway is not equipped to handle.
EXHIBIT 4
Even as the broader economy decarbonises, emissions generated by the Norwegian plastics system, on its current trajectory, are set to grow by 21% to 2040.
GHG emissions, % change relative to 2020

Note that the 2030 and 2050 climate targets are not specific to the plastics system. These are emissions targets for the Norwegian economy and have been shown for reference.
Nationally Determined Contributions (NDCs) are targets set by individual countries to reduce national emissions.
Source: UNFCC
As a result, Norway’s reliance on fossil-based plastic manufacturing processes, followed by incineration at end-of-life, is currently set to continue.
As shown in Exhibit 4, this will result in a 21% increase in system-level emissions relative to 2020, rising to 3.4 million tonnes of CO2eq by 2040, despite macro-decarbonisation factors. The trajectory of the Norwegian plastic system under a business-as-usual scenario is therefore fundamentally misaligned with Norway’s nationally defined climate commitments, which stipulates a 55% emissions reduction by 2030 and a 95% reduction by 2050, relative to 1990 levels, as well as with the global climate target of limiting average global warning to 1.5 degrees.
Momentum is building throughout the plastic system, but current policy and industry commitments are inadequate to bring about the required transformation.
The Norwegian plastic system is already taking notable strides towards addressing the dual challenges of resource inefficiency and climate change mitigation, but progress is not happening fast enough to align with the goals of either the European Green Deal4, or the Paris5 and Glasgow6 climate agreements.
There are varying levels of awareness and ambition for change in each of the in-scope sectors, as shown in Exhibit 4, with most policy and industry initiatives currently focused on packaging. In recent years,
Norway has adopted several key policies introduced by the EU, including the Packaging and Packaging Waste Regulation7 and the Single Use Plastic Directive8, both of which set ambitious targets for recycling rates and reduction. In addition, large fast-moving consumer goods (FMCG) companies are setting ambitious voluntary commitments to increase recyclability and integrate recycled content in their plastic products.
If met, these commitments will go a long way towards curbing pollution, waste disposal, and GHG emissions, but will still fall short of achieving a highly circular, low-emissions system.
In the five durable plastic sectors, the credibility of existing policy and industry commitments, including their likelihood of being met, were assessed against criteria based on the influence of the target setter and their development of KPIs and a viable roadmap towards achieving the stated targets.
EXHIBIT 5
Current commitments in most sectors, particularly durable applications and household goods, lack ambition
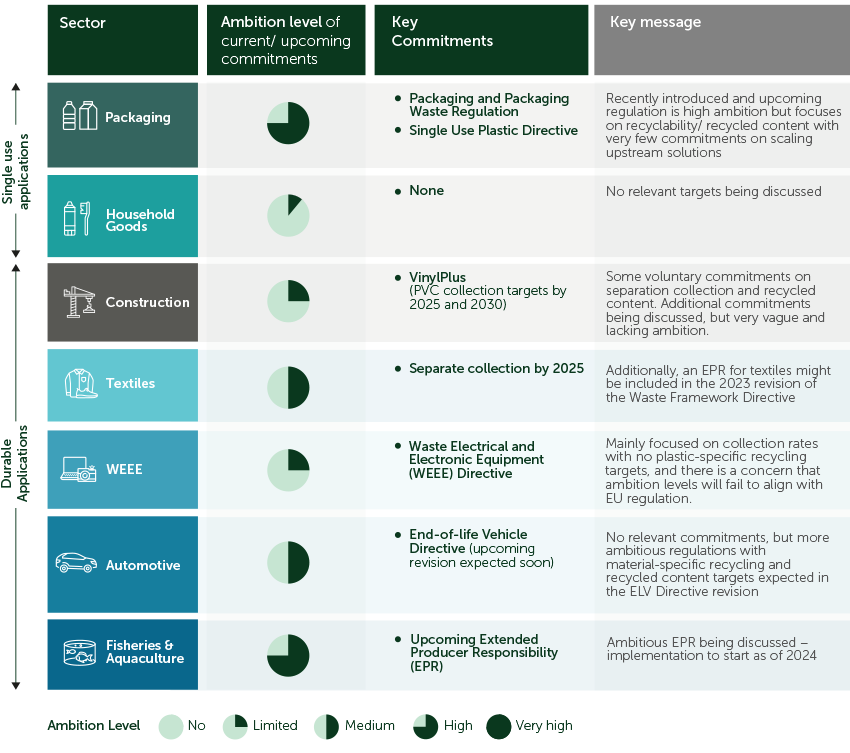
* Qualitative Assessment of all current commitments identified – not just the ones fitting the criteria
Of the sixteen commitments assessed for durable sectors, only two met the criteria and were therefore quantified in the analysis: the separate collection of textiles by 2025, and the PVC collection targets in construction set by VinylPlus9.
If met, these current commitments will result in an increase in the system circularity of durables from 21% today to 31% by 2040, and a corresponding ~7% reduction in system GHG emissions relative to the business-as-usual scenario.
The impact of existing commitments is clearly inadequate to transform the Norwegian plastic system into a highly circular, low-emissions system.
There are growing levels of ambition throughout the system, but the translation into action, through setting strict, concrete targets – both in the policy space and across different industries – and the development of roadmaps towards these targets, is lacking. More needs to be done to formalise commitments and hold the parties responsible for achieving them accountable.
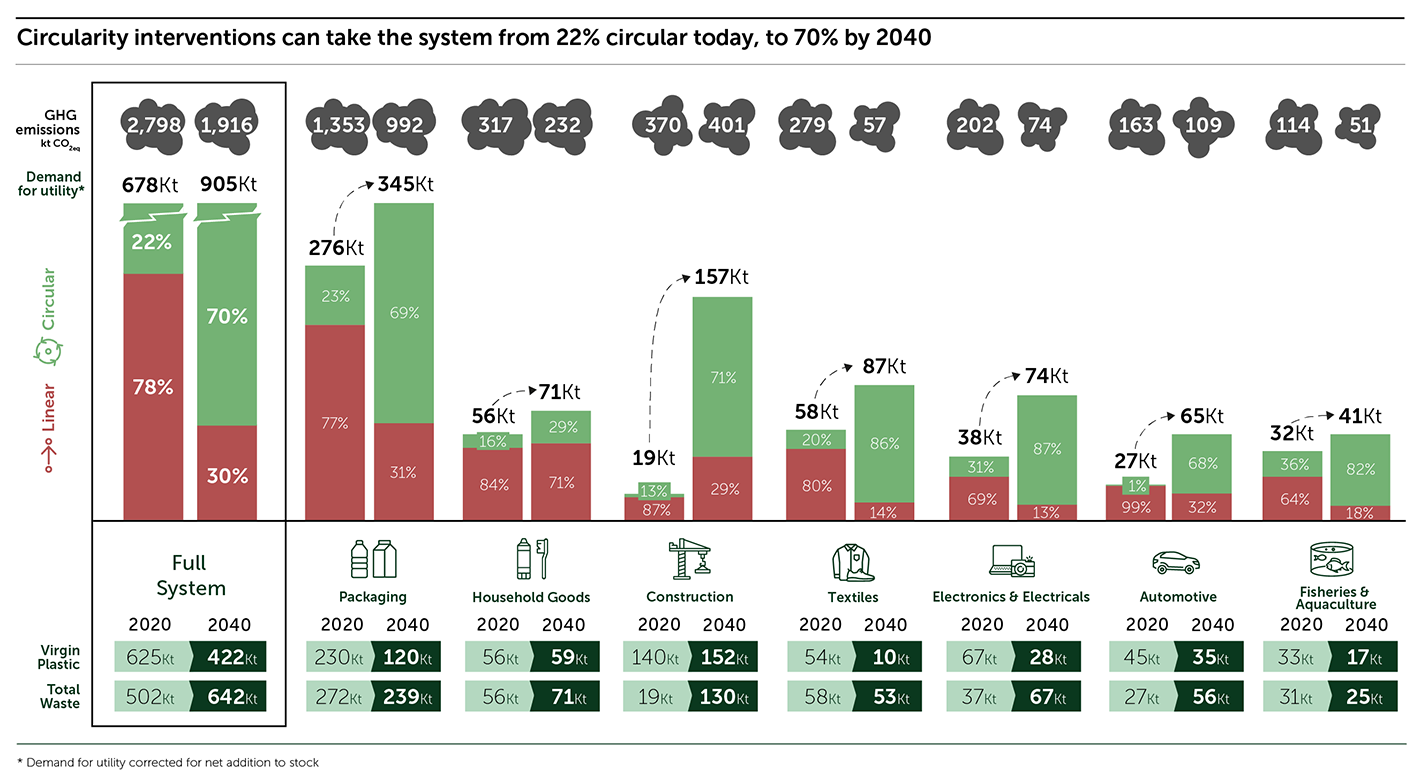
Through the ambitious application of circularity interventions along the value chain, 70% circularity can be achieved by 2040, reducing emissions by 32%, disposal by 35%, and virgin plastic demand by 33% relative to 2020, while continuing to meet demand for utility and delivering the benefits plastic brings to society and the economy.

Circularity is the fastest, most cost-effective, and most reliable way to abate the GHG emissions generated by the Norwegian plastic system.
Almost a third of the system’s GHG emissions can be reduced through circularity interventions alone.
Five categories of system interventions (see Exhibit 6) must be applied ambitiously, concurrently and starting now in order to reach higher levels of circularity. Under this scenario, mechanical recycling could become the primary destination for Norway’s plastic waste by 2040, accounting for 33% of demand for plastic utility, while reduction and reuse could account for 23% of the circularity solution, and chemical recycling for 11%.
EXHIBIT 6
Circularity interventions can take the system from 22% circular today, to 70% by 2040

Circularity is the fastest, most cost-effective, and most reliable way to abate the GHG emissions generated by the Norwegian plastic system.
Tap the chart below to see a Full System analysis of Norwegian Circularity from 2020 to 2040.
Reduction
Reduction can avoid up to 23% of plastic consumption via three main strategies:
- Elimination through dematerialisation of products (e.g. shifting from keyboards/laptops to tablets), lifetime extension of products (e.g. fishing nets), and innovative design (e.g. using edible coatings as alternatives to packaging for food).
- New delivery models enabling the sharing and/or reutilisation of products (e.g. dispensers and refilling stations to replace single-use packaging, rental models for clothing, and car-sharing models).
- Reuse of products once they have been discarded as waste (e.g. reuse of a refurbished bumper on a vehicle, and reuse of window frames from a demolished building).
Chemical Recycling
Chemical Recycling via plastic-to-plastic chemical conversion technologies could increase to 11% of demand for utility by 2040, tackling 90,000 tonnes of plastic waste that is hard to mechanically recycle, particularly in the packaging, automotive, WEEE and construction sectors. These technologies, while relatively nascent, could offer a solution for amongst others food-contaminated products, additive content, and mixed polymer shredder residue (e.g. in WEEE and automotive), and deliver virgin quality polymer. However, this intervention must be implemented complementarily with the expansion of mechanical recycling, tackling only plastic types that are hard to mechanically recycle, and be designed to minimise GHG emissions.
Substitution
Substitution with alternative materials (mainly coated paper and compostables), where beneficial, avoids 3% of plastic consumption and is almost exclusively relevant for packaging applications. No at-scale applications of substitute materials were identified for plastics in durable applications, although this could change in the future.
Mechanical Recycling
Mechanical Recycling of plastic products and materials could increase to 33% of demand for utility, relying primarily on the widespread adoption of design for recycling standards in all sectors, as well as the formation of supply-chain partnerships, and the rapid scaling up and optimisation of domestic collection and sorting infrastructure.
Policy support is also required via the setting of plastic-specific recycling targets in each sector, as well as industry commitments on recycled content in order to spur the growth of the recyclate market. This requires Norway’s dedicated collection capacity to increase by 64% (~238,000 tonnes), either by moving away from mixed waste collection or by working with municipal waste systems to guarantee better sorting capacity and technologies (which are necessary to increase the quality of recyclates). This intervention requires mechanical recycling capacity to treat Norway’s waste to almost triple to enable it to treat 273,000 tonnes of plastic waste by 2040, compared to 94,000 tonnes in 2020.
Clean up
Clean up of polluting sources can reduce leakage into nature by 66%, to 3,500 tonnes by 2040, down from over 10,000 tonnes today. This is most relevant for packaging, industrial cables left underground, and fishing gear, and will most likely be driven by a combination of stronger regulation and greater levels of enforcement.
EXHIBIT 7
System interventions and corresponding levers improve circularity in the sectors with varying degrees of impact, reaching circularity levels of 29% – 87% by 2040
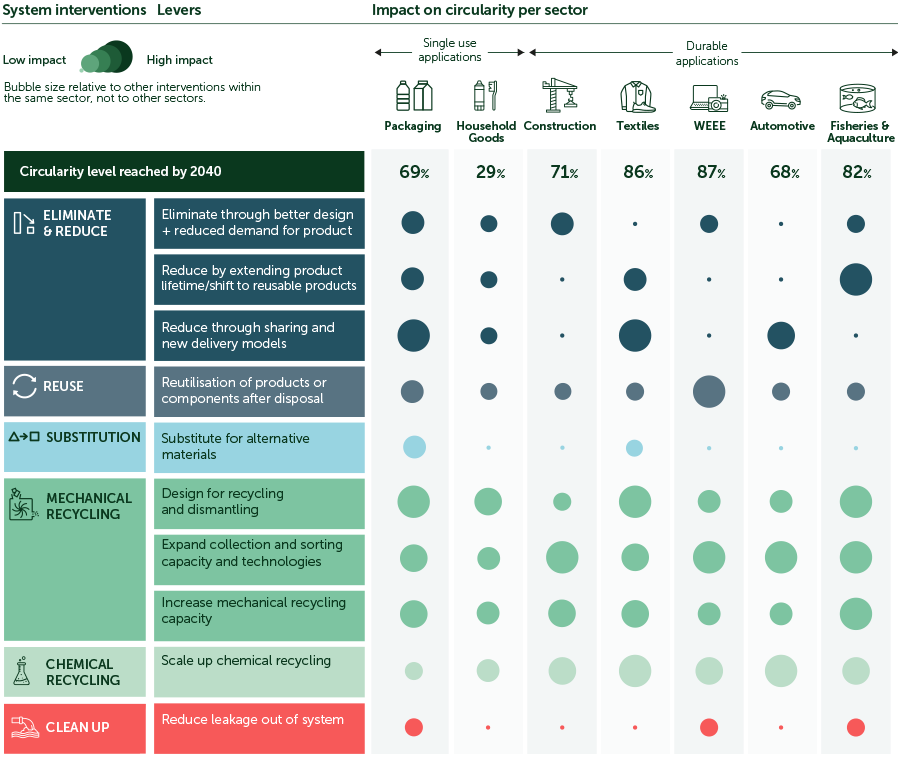
Sector-specific conditions and challenges mean that the seven sectors analysed rely on each intervention to varying degrees and will experience different levels of impact, as shown in Exhibit 7.
Consumable and durable applications also face distinct challenges, and hence their potential for circular transformation varies. While consumable applications are limited to circularity levels of 29% – 69% by 2040, durable applications could achieve much higher levels of 68% – 87%.
A large part of the current problem stems from the single-use, disposable nature of many plastics and the convenience of the throwaway culture that consumers have become accustomed to. Therefore, upstream solutions – particularly reduction via elimination, new delivery models, and substitution – are most impactful for consumable applications, where single-use plastics should be eliminated, avoided, substituted, or made durable wherever possible.
On the other hand, in sectors that use plastics for an extended period of time, plastic proves to be a suitable choice for higher value, durable applications where it can provide utility for several years. In these cases, there are greater incentives for repair, extension of lifetime, separate collection, etc. However, there is still room for optimisation of the use of plastic in durable applications, particularly through greater reuse, elimination of unnecessary plastics, and a shift to sharing models. All applications rely on downstream solutions, mechanical and chemical recycling, to a large degree.

Applying all circularity levers reduces GHG emissions by 32%, but still leaves 1.9 million tonnes of CO2eq of emissions by 2040h (down from 2.8 million tonnes in 2020), requiring additional levers to achieve a Net-Zero Scenario.
Production and end-of-life emissions abatement technologies can reduce emissions by a further 22% and 14%, respectively, to just 0.7 million tonnes of CO2eq of residual emissions by 2040, bringing the Norwegian plastic system into alignment with the Paris Agreement targets.
Circularity alone reduces emissions by only 32% by 2040 and is therefore insufficient to bring the system into alignment with Norway’s climate target to achieve a 55% reduction in GHG emissions compared to 1990 levels by 2030 (equivalent to a ~63% reduction compared to 2019) and a 90-95% reduction by 2050.10 Therefore, beyond circularity, there is a need for emissions abatement technologies.
The majority of residual system emissions are from fossil fuel-based manufacturing processes and end-of-life incineration. Three main supply-side strategies can be combined to abate these remaining emissions (see Exhibit 8).
EXHIBIT 8
Three supply-side strategies to abate residual emissions along the value chain.
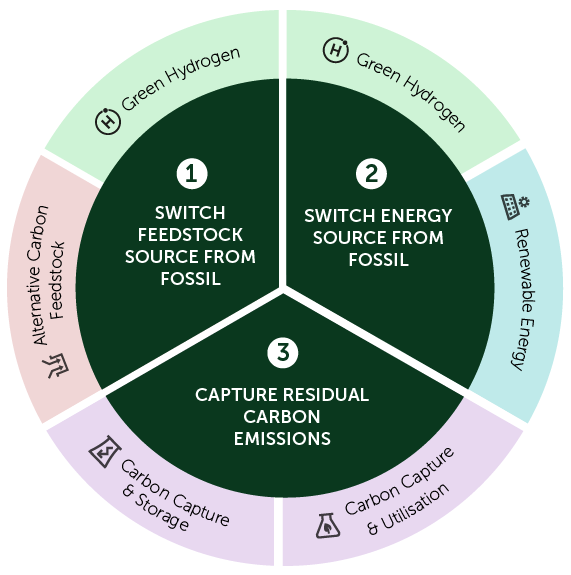
EXHIBIT 9
Through ambitious application of circularity and emissions abatement measures, a 75% emissions reduction can be achieved by 2040 relative to 2020 in the Net Zero Scenario.

Norway’s 2030 climate target is a 55% reduction relative to 1990, which is approximately a 68% reduction relative to 2020
By applying these three emissions abatement measures to virgin plastic production, i.e. using green hydrogen and alternative carbon feedstocks such as biomass and captured CO2 to decouple from fossil fuel feedstocks, switching to renewable fuels, and capturing residual process emissions, a further 700,000 tonnes of CO2eq could be avoided by 2040.
In addition to these supply side strategies, by capturing emissions from end-of-life incineration through the application of CCUS, it is estimated that an additional 500,000 tonnes of CO2eq could be avoided by 2040.
Together with the circularity interventions, these measures can reduce emissions from the Norwegian plastic system by 75% by 2040 relative to 2020. While this pathway still falls short of achieving Norway’s 2030 climate targets (Exhibit 9), it sets the system on track to achieving net-zero by mid-century, in line with Norway’s 2050 climate goal.
The System Change Scenario is the cheapest scenario for durable plastic as it drives resource and capital efficiency. At the same time it is slightly more expensive for consumable applications due to the start-up costs of new delivery models and substitution materials.
The Net-Zero Scenario requires an estimated capital investment which is about 30% higher than the capital investment in the System Change Scenarioi. At the same time, shifting to this low-emissions circular scenario creates 1,300 additional jobs in the system.
Increasing circularity increases the 2020-2040 cumulative capex investment required in the System Change Scenario to NOK ~30.3 billion, 9% more than the Baseline Scenario, even though there are efficiencies as circularity drives both resource and capital efficiency as the expensive linear production infrastructure buildout is avoided and plastic utility is decoupled from production volume.
While there are also capital efficiency gains in some parts of the value chain due to a smaller, more circular system in the Net-Zero Scenario, the implementation of emissions abatement to production and end-of-life incineration requires an additional NOK 9 billion of direct capital to abate the residual emissions in the circular system (~63% of which is to abate virgin production and ~37% for end-of-life incineration)j.
This represents a 41% increase in total cumulative investment to NOK 39 billion compared to the unabated linear system in the Baseline Scenario, a non-trivial increase in transition costs.
While this is only a modest increase in cumulative capex relative to the Baseline Scenario considering the cost of future externalities, the Net-Zero Scenario requires significant capital reallocation from mature and thus low risk business models and technologies to nascent, higher risk ones.
In terms of employment, 7% more jobs are created in a Net-Zero Scenario, representing a net job increase of ~1,300 jobs compared to 2020. As a result, 35% of system employment by 2040 could be in circular business models, i.e. reduction, reuse, and recycling value chains. However, jobs in primary production would decrease by around ~21%, requiring a large redistribution of employment opportunities along the value chain.
A just transition must ensure that the legacy fossil employee base is adequately reskilled to participate in the new low-emissions economy. Notably, if Norway chooses to domesticate its plastic value chain, this transition offers an employment opportunity for the highly skilled labour force currently dedicated to the oil and gas sector.
i This scenario considers 40% of production and 80% of incineration is abated by 2040.
j Noting that macro-economic decarbonisation factors, such as abatement costs of other sectors or broader economic electrification, have not been included.
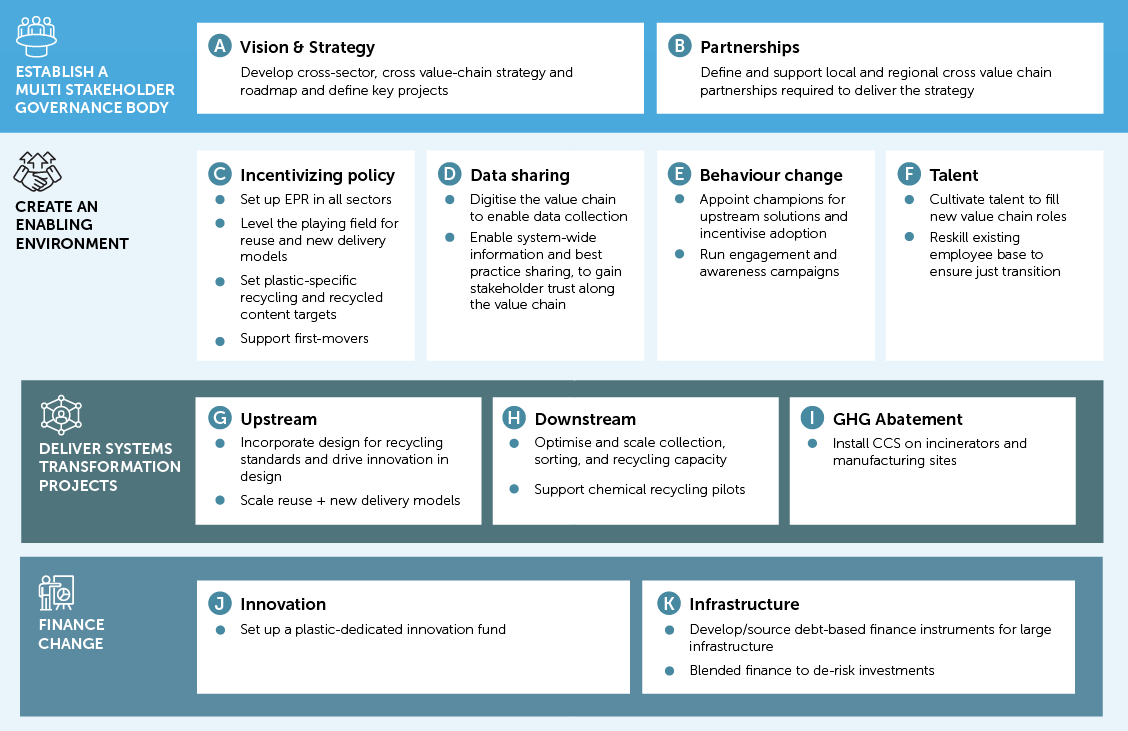
The transition of the Norwegian plastic system is highly complicated and thus centralising governance under a multi-stakeholder systems transformation body, involving makers, users, and regulators, may help accelerate the process.
The framework in Exhibit 10 presents the key capabilities and actions needed over the next five years to accelerate the transition towards a highly circular, resource efficient, low-emissions Norwegian plastic system, as outlined in this report. The first step is to align behind a shared vision and strategy to address the current challenges of high GHG emissions and resource inefficiency.
EXHIBIT 10
Systems change capability framework for the Norwegian plastic system