Over 72% of Norwegian plastic is ultimately sent to waste-to-energy incineration facilities (including 37% incinerated outside of Norway), while only up to 25% is recycled in practice, excluding losses (Exhibit 3). Further modelling under the Business-As-Usual scenario shows that the mass of Norway’s plastic waste (in the project scope) could grow from 289,000 tonnes in 2019 to 376,000 tonnes in 2040, equivalent to a compound annual growth rate (CAGR) of 1.2%.
Chapter 2
The Current Norwegian Plastic System Is Fundamentally Misaligned With A Zero-Waste Circular Plastic Economy
A risky pathway: The Norwegian plastic system relies heavily on waste-to-energy incineration and waste exports
Waste disposal (defined as waste-to-energy incineration, sanitary landfilling, and plastic-to-fuel chemical conversion) could therefore grow from 212,000 tonnes in 2019 to 278,000 tonnes in 2040 (an 31% increase)
EXHIBIT 3
Plastic fate under the Business-As-Usual scenario: a wedges analysis
WE PROJECT UP TO 25% OF NORWEGIAN PLASTIC WILL BE RECYCLED BY 2040 UNDER BUSINESS-AS-USUAL
‘000 metric tonnes

Waste generated in Norway excluding imports; includes waste that is treated in Norway and exported.
This “wedges” shows the share of treatment options for the plastic that enters the system over time under the Business-as-usual scenario. Any plastic that enters the system has a single fate, or a single “wedge”. The Recycle wedge accounts for the plastic that is recycled in the system, either mechanically or chemically. The Dispose wedge includes plastic that cannot be reduced, substituted, or recycled but is managed in a way that ensures that it does not leak into the environment. All other plastic is considered Mismanaged.
This expected growth in waste-to-energy incineration has significant consequences for Norway’s economy, and climate commitments:
- Waste-to-energy incineration greenhouse gas (GHG) emissions represent up to 4% of Norway’s climate budget by 2030
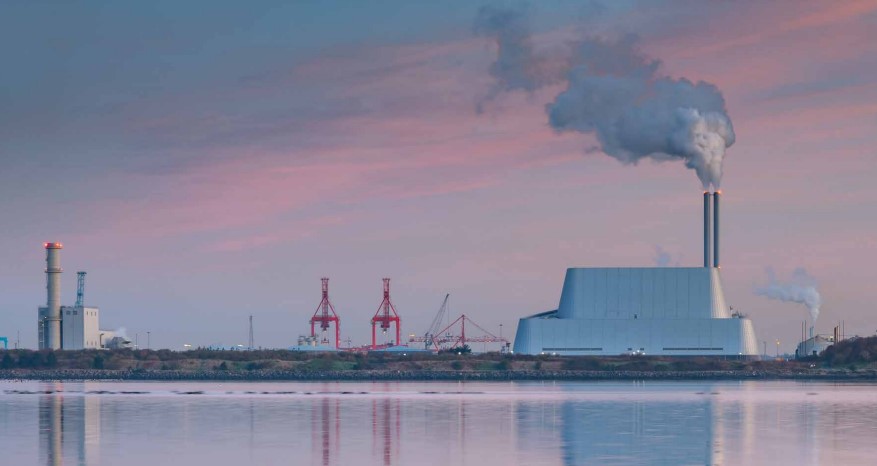
Waste-to-energy incineration offers an effective alternative to landfill by reducing both the volume and mass of waste. Modern waste-to-energy incinerators also produce moderate amounts of electricity and heat, which can be used as an alternative to purely fossilbased sources, but they are considered a “skyfilling” 17 waste management solution. However, continued waste-to-energy incineration of plastic creates a big GHG problem for Norway compared to the mechanical recycling of plastic and decarbonisation of electricity production through renewables. Norway’s cumulative carbon budget is 194 million tonnes of CO2eq by 203018.
Under Business-As-Usual, we estimate that 11% of this, or 21 million tonnes of CO2eq , will be used by the plastic system. Waste-to-energy incineration alone – which we estimate to generate 2.5 tonnes of CO2eq /tonne of waste incinerated19 – represents approximately 37% of this, amounting to 4% of Norway’s total carbon budget. Incineration also creates a need for more virgin material, which accounts for 36% of plastic sector emissions. Continuing this practice will make it extremely difficult for Norway to meet its target of reaching net-zero carbon by mid-century. Carbon capture and storage could provide a way to limit incineration emissions but, while a pilot by Fortum Oslo Varme (FOV) and Norcem is ongoing, it has not yet proven economic viability at scale.
- Plastic waste-to-energy incineration is a missed economic opportunity to recover significant value
Waste-to-energy incineration is an emblematic “linear” solution that contradicts the fundamental concept of a zero-waste circular plastic economy. The EU waste hierarchy20 restricts its use to unavoidable and unrecyclable plastic waste generated after maximum efforts to design plastic waste out of the system and design for recycling. By burning waste material to recover its energy, Norway is not only wasting the intrinsic value of the material but is actually paying to do so – at an annual cost of over NOK 100 million, by our estimates. From an economic perspective, this represents a missed opportunity to build a profitable industry on the back of what today is an externality.
Rectifying this requires bringing more value back to post-consumer waste. Improvements in packaging design, sorting, and recycling technologies, along with a functioning market with higher and more diverse demand as well as higher prices for recycled plastics, means that more and more post-consumer plastics will have a positive value for recyclers. A transition away from incineration and towards recycling therefore makes strong economic sense over time, and this process can be accelerated and incentivised through extended producer responsibility (EPR) policies.
Another problem is that incineration may be hindering the growth of the recycling industry, as large incinerators compete for materials with high calorific value, including plastic. Incinerators require constant “feeding” during their entire lifespan (25 to 50 years) to maximise their financial output, triggering demand for low value waste feedstock with high plastic content. This might create a “lock-in” effect and impede the development of more desirable solutions, such as better sorting and recycling facilities, making it more difficult to improve recycling rates. Ultimately, these unintended consequences might act as incentives to maintain less advanced sorting technologies and create negative demand and supply feedback loops for secondary plastic materials prices.
- Waste-to-energy incinerators and pollution
It is well documented that the combustion of municipal solid waste can result in the release of pollutants21. However, research in the UK and France indicates that well-managed modern incinerators, like those in Norway, are unlikely to pose significant health risks 22,23,24 or contribute significantly to air pollution. This is because such incinerators can reduce atmospheric emissions by controlling the temperature, the composition of input material, and the speed of material flows in the furnace, and by cleaning the flue gas.
- Apart from flue output, incinerators produce two solid outputs: bottom ash and fly ash. Bottom ash is an inert material mostly comprised of minerals that can be valorised for road construction, although concerns regarding its toxicity have been raised. Fly ash consists of airborne emissions, is considered hazardous and needs to be disposed of in hazardous waste landfill sites25.
EXHIBIT 4
Fate of plastic waste collected in Norway in 2019
WE ESTIMATE 61% OF NORWEGIAN PLASTIC IS TREATED OUTSIDE OF NORWAY
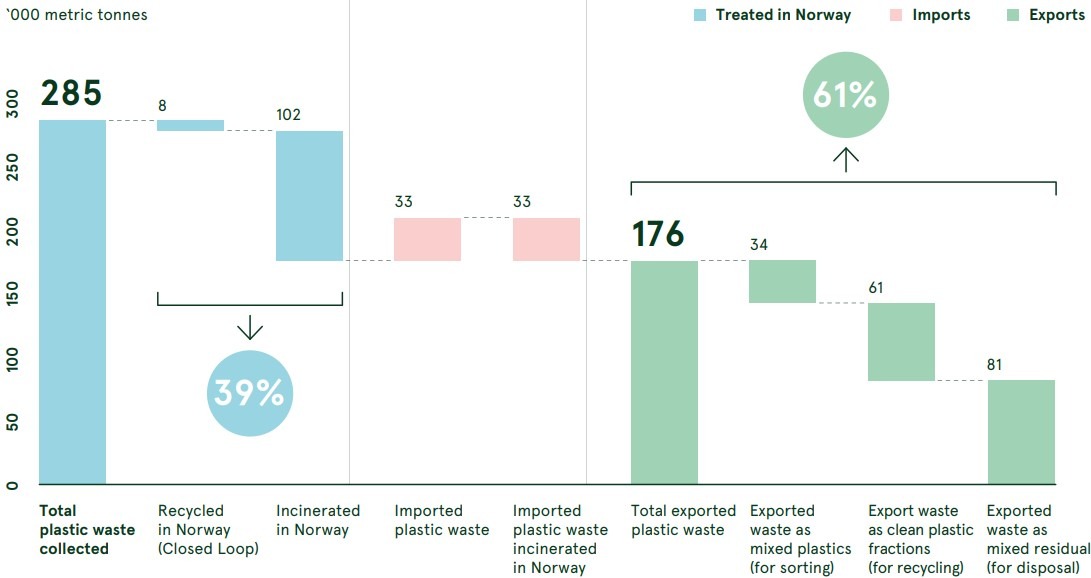
The Norwegian plastic system is heavily reliant on exports26 – much more so than most other countries in the Global North, to a large extent due to Norway’s size. Our analysis shows that, in 2019, only 109,000 tonnes (39%), of the plastic waste collected in Norway was processed in Norway, while 176,000 tonnes (61%) was exported (Exhibit 4). Exports are made up of three main streams: clean plastic fractions for recycling, such as beverage bottles from deposit schemes (61,000 tonnes or 35%); mixed plastic from source sortation (34,000 tonnes or 19%); and mixed waste (81,000 tonnes or 46%). As Exhibit 5 shows, we estimate that 61% of exports go to waste-to-energy incineration, with the largest share coming from unsorted waste.
EXHIBIT 4
Breakdown of plastic waste exports in Norway
OVER 60% OF EXPORTED NORWEGIAN WASTE IS ESTIMATED TO BE INCINERATED
‘000 metric tonnes

Exporting plastic waste risks a loss of control over its final destination and prevents Norway from meeting its zero landfill and zero littering policies, at least abroad. While exports to EU countries are not generally considered problematic, the ultimate fate of the rejects and/or losses from exports is potentially exposing Norway to a landfill footprint which contradicts its national ban. Our analysis shows that up to 5,000 tonnes of plastic waste from Norway might find its way to European landfills. Although Norwegian authorities have reporting mechanisms in place and conduct frequent inspections of the industry, an even better traceability of the fate of export residues – in addition to improved design for recycling, measures to boost the demand for recyclables, and more effective sorting of waste – is essential if Norway wants to achieve a zero plastic to landfill footprint in the future.
“Over 72% of Norwegian plastic is ultimately sent to incineration, while only up to 25% is recycled in practice”
Exports of business-to-business (B2B) packaging waste outside of the EU, and notably to South East Asia (e.g. Vietnam, Malaysia), expose Norway to the risk of its plastic being disposed of in unsanitary landfills, leaked to waterways, and/or burnt openly. Such exports require more thorough monitoring to ensure that safe and environmentally sound recycling is taking place. Current practices, and the lack of proper waste management facilities (such as well managed waste-to-energy incinerators or sanitary landfills) in some countries, present a significant risk for Norway (as well as most European countries).
While it is difficult to put an exact figure on these flows, we estimate that between 1,000 and 2,000 tonnes of Norwegian plastic waste may be at risk of being disposed of in unsanitary landfills, leaked to waterways and/or burnt openly every year. Recent changes in the Basel Convention, including the amendment signed in May 2019 that entered into force in 2021, following a Norwegian initiative, clarify the way plastic waste can be internationally traded and bring additional types of plastic waste into the existing control mechanism known as the Prior Informed Consent (PIC) Procedure.
The amendments also specify measures to support implementation, especially by developing countries. Finally, it is worth noting that, as a result of economic opportunities, Norway also imports waste to be incinerated with energy recovery in Norway. We estimate that approximatively 33,000 tonnes of plastic waste were imported for waste-to-energy incineration in 2019 – most of which came from the United Kingdom (and is not included in the figures in this chapter). That means 24% of the plastic waste incinerated in Norway is imported.
No silver bullets: Single-solution strategies cannot achieve a zero-waste circular plastic economy
Our analysis shows that none of the scenarios that include only upstream interventions (defined as pre-consumer interventions, such as reduction, substitution, or design for recycling) or only downstream interventions (defined as post-consumer interventions, such as collection, sorting, recycling and disposal) is satisfactory from a socioeconomic or environmental perspective.
Upstream Scenario:
Reduce and Substitute
For the Reduce and Substitute scenario, we model upstream system interventions: ambitious plastic reduction, substitution with other materials (when beneficial), and design for recycling. Upstream design innovations like these are known to be critical in shifting to a circular economy and often have the best combination of cost, performance, and convenience. Under the Reduce and Substitute scenario – where upstream interventions are scaled to their maximum foreseeable potential within technical, economic, and climate constraints – the circularity index27 increases from 25% today and under Business-As-Usual to 47%, a significant improvement. However, there is only a marginal increase in the recycling rate – from 25% to 27% – due to the development of design for recycling, and not fundamentally change to the current incineration paradigm. While this scenario reduces the demand for plastic products by 28% and decreases GHG emissions by 17%, relative to BusinessAs-Usual, it also leads to a net loss of jobs. The fact that the Reduce and Substitute scenario does not effectively deal with unavoidable plastic waste, highlights the importance of pairing upstream and downstream interventions.
“None of the scenarios that include only upstream or only downstream interventions is satisfactory from a socio-economic or environmental perspective”.
Downstream Scenarios:
Scale-up of the Sorting Backbone; Central Sorting and Recycling Scale-up; Ambitious Sorting and Recycling Scale-up
Next, we model a series of scenarios centred on predominantly downstream system interventions. In the Scale-up of the Sorting Backbone scenario, we assume a moderate increase in sorting at source and the strong development of sorting infrastructure (for both sorted at source and mixed waste), paired with design for recycling and breakthrough sorting technology innovation by 2040. This scenario brings the recycling rate and circularity index up to 55%. Despite representing a big improvement over Business-As-Usual, this scenario highlights the technical limitations of downstream solutions, even with ambitious system improvements. This scenario is also moderately beneficial compared to other single-strategy scenarios as it allows GHG emissions to be reduced by 12%, due to a reduction in waste-to-energy incineration, at no additional net cost for the system and while providing domestic job creation in material recovery facilities (MRF). It demonstrates that sorting is the cornerstone of any strategy to increase recycling rates.
The Central Sorting and Recycling scenario relies on the scale-up of a uniform national mixed waste collection system (excluding food waste) and central sorting infrastructure able to process all the plastic waste generated in Norway, paired with design for recycling and breakthrough sorting and recycling technology by 2040. In addition, mechanical recycling and chemical conversion are scaledup as ambitiously as realistically feasible. This scenario brings the recycling rate and circularity index up to 57% and reduces GHG emissions by 11% compared to Business-AsUsual by 2040.
In the Ambitious Sorting and Recycling Scale-up scenario, we assume that design for recycling, sorting, mechanical recycling, and chemical conversion are scaled up as ambitiously as can be realistically imagined. This scenario allows Norway to meet EU recycling targets and reach a comfortable 61% recycling rate and similar circularity index. At this point there is little room for additional improvements in the system given technological limitations at each step (through losses in sorting and recycling). It is therefore unlikely that recycling rates can get any higher under the current paradigm, even assuming ambitious technological improvements. This scenario achieves only a 13% reduction of GHG emissions compared to Business-As-Usual by 2040, due to the expansion of the energy-intensive chemical conversion industry. However, it generates a 16% growth in employment in the plastic sector by 2040 compared to Business-As-Usual and a reduction in system cost, driven by favourable assumptions in recycling economics.
EXHIBIT 6
Plastic waste fate under different scenarios
NONE OF THE “SILVER BULLET” STRATEGIES GENERATE A SIGNIFICANT REDUCTION IN WASTE DISPOSAL
‘000 metric tonnes

Those “wedges” show the share of treatment options for the plastic that enters the system over time under four scenarios. Any plastic that enters the system has a single fate, or a single “wedge.” The Reduce wedge represents plastic utility that has been fulfilled without using physical plastic. The Substitute wedge reflects plastic utility that has been fulfilled by alternative materials such as paper or compostable materials. The Recycle wedge accounts for the plastic that is recycled in the system, either mechanically or chemically. The Dispose wedge includes plastic that cannot be reduced, substituted, or recycled but is managed in a way that ensures that it does not leak into the environment. All other plastic is considered Mismanaged.
As shown in this chapter, the shift to a circular economy is not a matter of principle or ideology – it is backed by sound business logic. The cost of sending over 200,000 tonnes of plastic to waste-to-energy incineration every year and producing new virgin material is enormous – over NOK 100 million by our estimates. When coupled with the opportunity cost of that material, and the business opportunities offered by new ventures and business models, the costs of not transitioning to a circular economy become too large to ignore.
In the next chapter, we show how embarking on the journey to a zero-waste circular plastic economy creates significant opportunities for companies ahead of the curve, ready to embrace new business opportunities that unlock value from circulating materials rather than from the extraction and conversion of fossil fuels. Large new value pools can be created around better design, better materials, better delivery models, improved sorting and recycling technologies, and smart collection and supply chain management systems