The System Change Scenario achieves considerable benefits across multiple dimensions in the Norwegian plastic system: increased recycling rates, lower virgin plastic consumption, reduced waste-to-energy incineration, lower greenhouse gas (GHG) emissions, and less mismanaged waste.
Chapter 3
Achieving A Zero-Waste Circular Plastic Economy In Norway Is Possible With Existing Solutions
Size of the prize: An integrated zero-waste circular plastic strategy offer Norway multiple environmental, economic and social benefits
And all these benefits come at a comparable economic cost, without job losses, and can be achieved using existing solutions – if the 10 system interventions explained in this chapter are implemented across the entire value chain.
Put simply, it is not the lack of technical solutions that is preventing a zero-waste circular plastic economy and decarbonised plastic system in Norway, but rather insufficiently ambitious regulatory frameworks, business models, incentives, and funding mechanisms. If we overcome these challenges, the full potential of the System Change Scenario can be realised, as summarised in Exhibit 7.
EXHIBIT 7
Comparison of system outcomes between Business-As-Usual and the System Change Scenario
THE SYSTEM CHANGE SCENARIO PROVIDES CONSIDERABLE BENEFITS AT NO TRADE-OFF TO SOCIETY
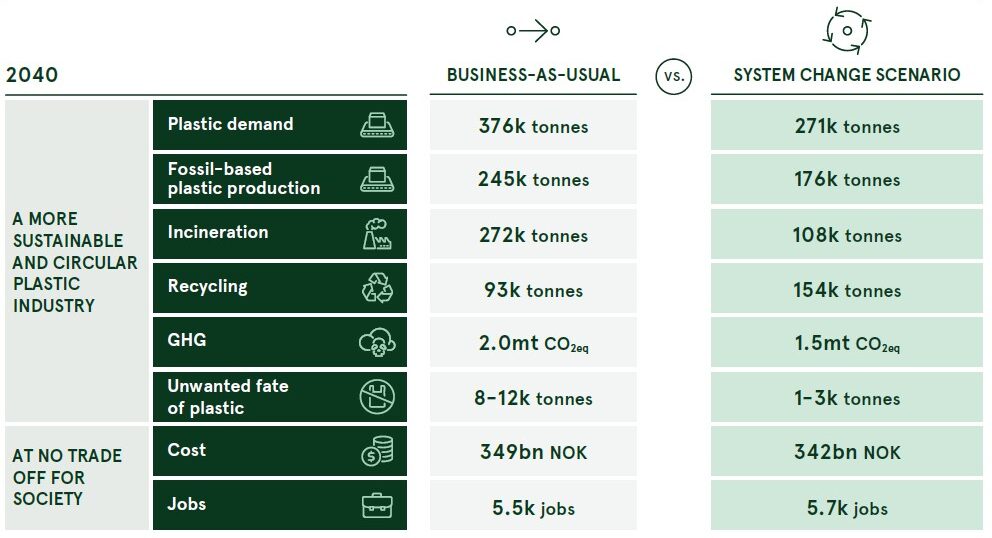
Plastic utility: Total satisfaction met from consuming a good or a service provided by plastic products in a business-as-usual scenario.
Plastic demand: Total amount of plastic demand for packaging and other household goods projected in 2040.
Recycling: Total amount of waste recycled in Norway or internationally from the waste generated in Norway, including mechanical recycling and chemical conversion (but excluding plastic-to-fuel technology).
GHG emissions: Total 2040 life cycle assessment emissions of all plastics (and substitutes), including production, conversion, collection, sorting, mechanical recycling, chemical conversion, waste-to-energy incineration, landfill, and open burn.
Unwanted fate of plastic: Total amount of plastic waste ending up as litter in Norway or which through exports has a high likelihood to enter landfill (in EU) or end up in a dumpsite or burnt in the open (in Asia).
Fossil-based plastic production:
Total amount of virgin plastic production in 2040.
Incineration: Total amount of plastic waste generated in Norway and incinerated with energy recovery either in Norway or outside of Norway in 2040 (excluding imports).
Costs: Cumulative present value of net costs incurred between 2021 and 2040 (capex and opex) incurred by all waste generated in Norway (including revenue streams) across the entire plastic value chain (i.e. plastic production, packaging conversion, collection, sorting, recycling and disposal including export costs, as well as the same cost for substitute materials, and estimated costs for new business models).
Job creation: Number of direct jobs in 2040 for all plastics (and substitutes), including production, conversion, collection, sorting, mechanical recycling, chemical conversion, waste-to-energy incineration, landfill, as well as new delivery models. This number include jobs in Norway and outside of Norway, the share of which could not be estimated given complex value chains.
Norway’s plastic system is at a critical inflection point. The country can decide either to continue under Business-As-Usual and preserve a mostly linear system with only a 25% recycling rate (a future in which an estimated 97,000 tonnes would be recycled by 2040 compared to nearly 270,000 tonnes incinerated with energy recovery) or embrace an ambitious yet credible zero-waste circular plastic economy pathway where circular solutions account for an estimated 69% of plastic waste.
EXHIBIT 8
Plastic fate in the System Change Scenario: a wedges analysis
THE SYSTEM CHANGE SCENARIO HAS A 69% CIRCULARITY RATE
‘000 metric tonnes
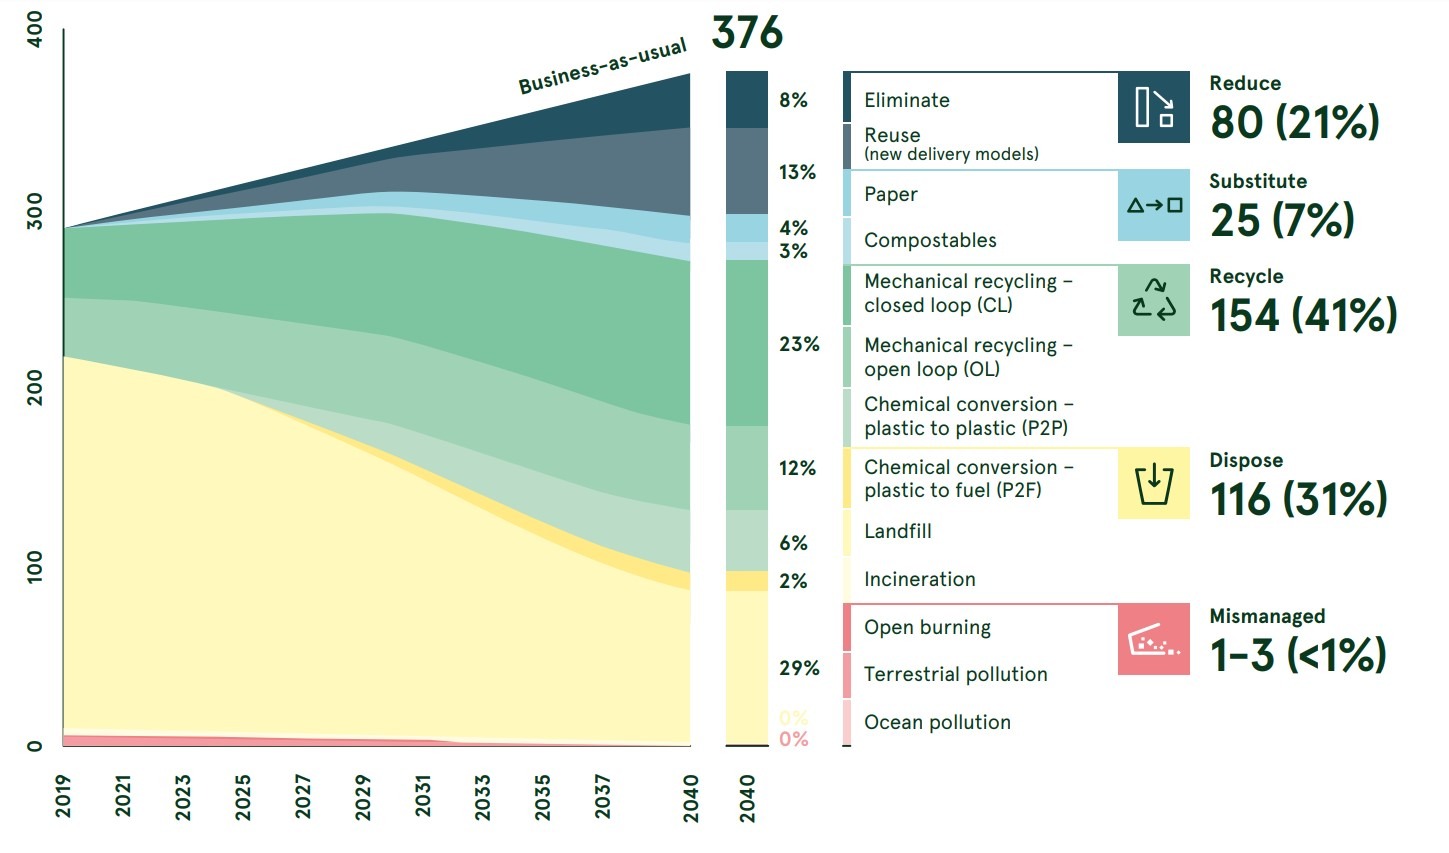
Waste generated in Norway excluding imports; includes waste that is treated in Norway and exported.
This “wedges” shows the share of treatment options for the plastic that enters the system over time under the System Change Scenario. Any plastic that enters the system has a single fate, or a single “wedge.” The Reduce wedge represents plastic utility that has been fulfilled without using physical plastic. The Substitute wedge reflects plastic utility that has been fulfilled by alternative materials such as paper or compostable materials. The Recycle wedge accounts for the plastic that is recycled in the system, either mechanically or chemically. The Dispose wedge includes plastic that cannot be reduced, substituted, or recycled but is managed in a way that ensures that it does not leak into the environment. All other plastic is considered Mismanaged.
“it is not the lack of technical solutions that is preventing a zero-waste circular plastic economy in Norway, but rather insufficiently ambitious regulatory frameworks, business models, incentives, and funding mechanisms”
The System Change Scenario offers multiple environmental, economic, and social benefits, including: (a) a more efficient use of resources with a significant reduction of fossil-based virgin plastic; (b) a contribution to the fight against climate change; (c) a reduction in mismanaged plastic waste, reducing the impact on Norwegian ecosystems; and (d) a shift away from waste-to-energy incineration.
More efficient use of resources with a significant reduction of fossil-based virgin plastic.
Our analysis estimates that 289,000 tonnes of plastic material entered the Norwegian market in 2019; this could increase to 376,000 tonnes by 2040 under Business-As-Usual.
The share of virgin plastic demand is conservatively estimated at 259,000 tonnes in 2019, and only marginally decreases, to 245,000 tonnes by 2040, in the Business-As-Usual scenario, due to the increasing use of recycled content and bio-based feedstock, as shown in Exhibit 9. In the System Change Scenario, virgin plastic can be reduced further to 176,000 tonnes by 2040, a 28% reduction – essentially decoupling economic activity from the growth of virgin plastics. Note that, in both the System Change Scenario and Business-As-Usual we assume a similar share of recycled content and bio-based content to replace demand for virgin material. The share of virgin plastic in the System Change Scenario is further decreased due to the combined impact of reduction and substitution levers.
Contribution to the fight against climate change
Under Business-As-Usual, it is estimated that Norway’s plastic industry (from production to fate) will emit over 2 million tonnes of CO2eq annually by 2040. Under the System Change Scenario, this could be reduced to 1.5 million tonnes of CO2eq, a 25% reduction, achievable via the reduction of plastic in the system and a shift from virgin to recycled plastic. While this is a significant reduction for a “hard to abate” sector, it is not nearly enough to be aligned with the Paris Agreement, or with Norway’s net-zero carbon by 2050 target.
EXHIBIT 9
Virgin plastic demand under Business-As-Usual and the System Change Scenario
BY 2040, VIRGIN PLASTIC DEMAND COULD FALL BY 32% RELATIVE TO 2019 LEVELS UNDER THE SYSTEM CHANGE SCENARIO
‘000 metric tonnes
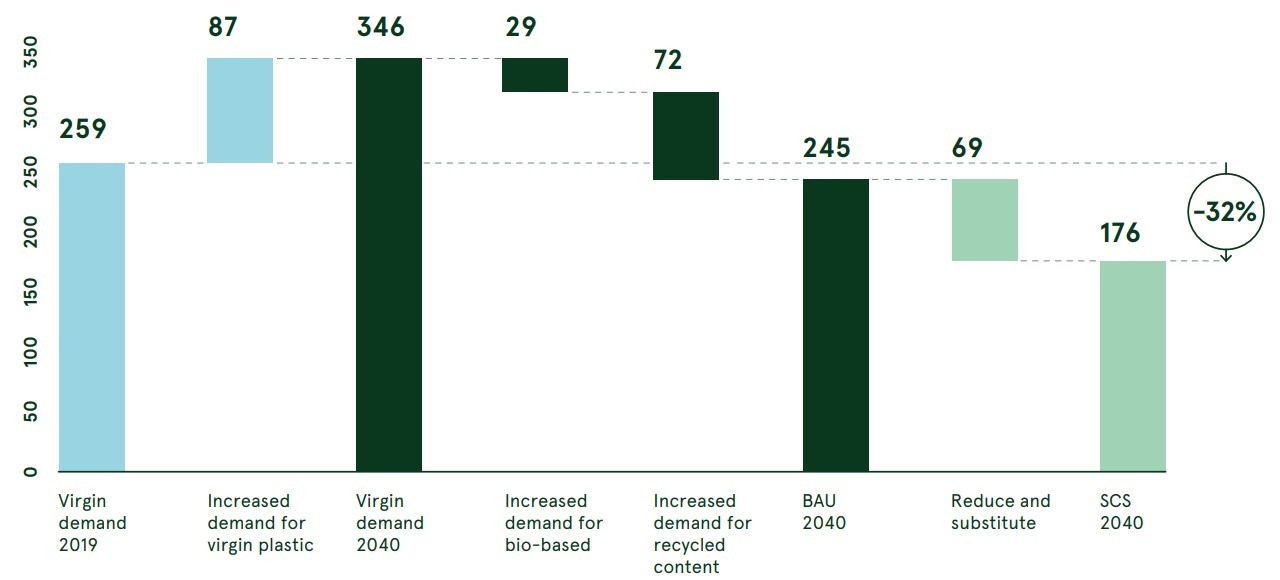
This figure shows virgin plastic demand in 2019, 2040, and in 2040 after the Reduce and Substitute levers are applied.
Achieving these more ambitious goals will require further decarbonisation efforts outside the scope of our analysis (including shifting to renewable energy, electrifying plastic production, shifting to bio-based feedstock, decarbonising waste-to-energy incineration, and more). And yet, a 25% reduction in GHG emissions as a result of dematerialisation and recycling is still an important contribution to the fight against climate change. At a social cost of carbon of US$ 50/tonne28 of CO2eq, this is equivalent to a net financial benefit of US$ 259 million to society between 2020 and 2040, which is excluded from the tangible financial outcomes covered in the rest of our analysis.
Reduction in plastic pollution
Norway is among the countries best positioned to reach near-zero plastic pollution; an ambitious target not yet achieved by any country. The System Change Scenario shows that this target is achievable through two main levers: (1) a better control of exports and (2) actions taken because of an increased understanding of littering and associated behaviour. In the Business-As-Usual scenario, we estimate that up to 8,000 -12,000 ‘tonnes of plastic (3-4% of Norway’s total plastic waste) could end up with an unwanted fate every year by 2040, of which 5,000 tonnes end up in landfills in Europe, 1,000 – 2,000 tonnes end up either in mismanaged landfills or being burnt openly in the Global South, and the remaining
2,000 – 5,000 tonnes are littered in Norway. The System Change Scenario shows that the unwanted fate of plastic could be significantly decreased – to an estimated 1,000 – 3,000 tonnes (0.5-1% of plastic waste) – of which the lion’s share is expected to stem from littering in Norway.
These estimates rely on the best available data, but it is important to acknowledge the high degree of uncertainty in littering and export data (see the technical appendix for further details on the assumptions used for this analysis). Nonetheless, it is safe to assume that the System Change Scenario would have a significant impact on littering given the reduction of plastic in the system and improvements to sorting and recycling, even if the precise figure is difficult to quantify.
Photo by Robert Bye on Unsplash
Moving away from waste-to-energy incineration in Norway and abroad
The System Change Scenario provides a compelling pathway for Norway to significantly reduce its reliance on waste-to-energy incineration by 2040. Under Business-As-Usual, the share of waste-to-energy incineration will remain over 72% of plastic by 2040, while the proposed 10 system interventions in the System Change Scenario could reduce this to 29% by 2040.
Under Business-As-Usual, we estimate that Norway would export up to 47% (104,000 tonnes) of its unsorted mixed plastic waste for waste-to-energy incineration by 2040, mostly to Sweden. In contrast, in the System Change Scenario, Norway can become self-sufficient in terms of waste-to-energy incineration capacity by 2040 with the current 2019 capacity (at least for its plastic waste stream). While market dynamics mean that it is possible some exports will continue even under the System Change Scenario, their pace is expected to reduce greatly.
Additionally, if plastic waste imports (which are excluded from all the other figures in this chapter) were taken into consideration in the System Change Scenario, by 2040, 41% of the plastic waste incinerated with energy recovery in Norway would come from imports (assuming Norway continues to import waste at current rates and excluding waste exported for waste-to-energy incineration).
Crucially, the System Change Scenario delivers these considerable benefits without additional costs to the system29 and without reducing employment. Our analysis shows that the cumulative net cost for society of managing waste in Norway between 2021 and 2040 is comparable between the Business-As-Usual and the System Change Scenarios, at NOK 349 billion and NOK 342 billion, respectively.
Similarly, the number of direct jobs supported by the industry is estimated at 5,500 for Business-As-Usual and 5,700 under the System Change Scenario by 2040 (including jobs both in and outside Norway). Overall, given the uncertainty attached to this analysis (e.g. regarding the price of oil), we can conservatively say that shifting to a zerowaste circular plastic economy can be done at no additional cost and will not reduce net employment (although jobs may shift from production to “green” jobs in recycling and service sectors). In addition, while we have only accounted for direct jobs, if indirect jobs were included, it is likely that the System Change Scenario would have a net positive impact on employment because the circular economy relies on services (as opposed to the linear economy that relies on manufacturing products), driving a shift from capitalintensive to labour-intensive industries.
Comparing scenarios and understanding trade-offs
Exhibit 10 compares the fate of plastic under the different scenarios modelled, as well as the recycling rate and circularity index for each scenario. As the exhibit shows, the System Change Scenario has the highest potential to achieve a zero-waste circular plastic economy.
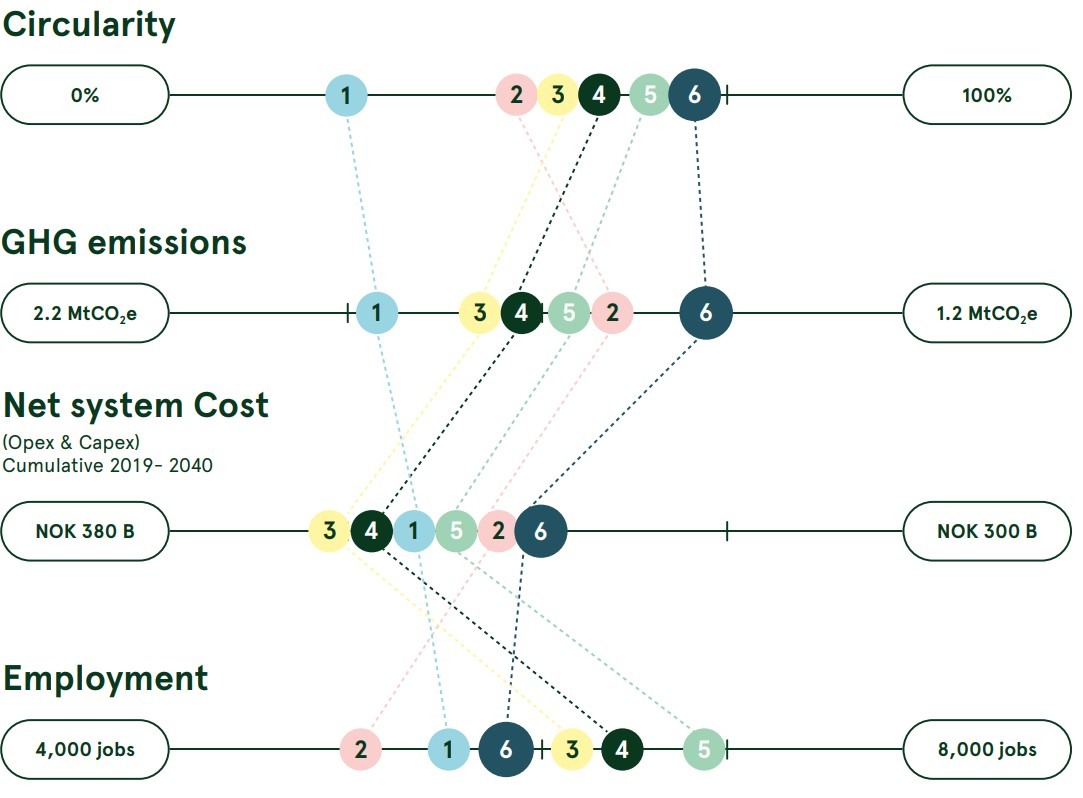
The System Change Scenario is not only more likely to achieve a zero-waste circular plastic economy, but it is also more desirable from a socio-economic and environmental perspective. When analysing trade-offs by comparing scenarios across key economic, environmental and social indicators, the System Change Scenario has the highest performance in three out of four indicators and is superior to the Business-As-Usual scenario in all four indicators, as shown in Exhibit 11.
EXHIBIT 10
Plastic waste fate, recycling rates, and circularity index under different scenarios
THE SYSTEM CHANGE SCENARIO HAS THE HIGHEST CIRCULARITY INDEX
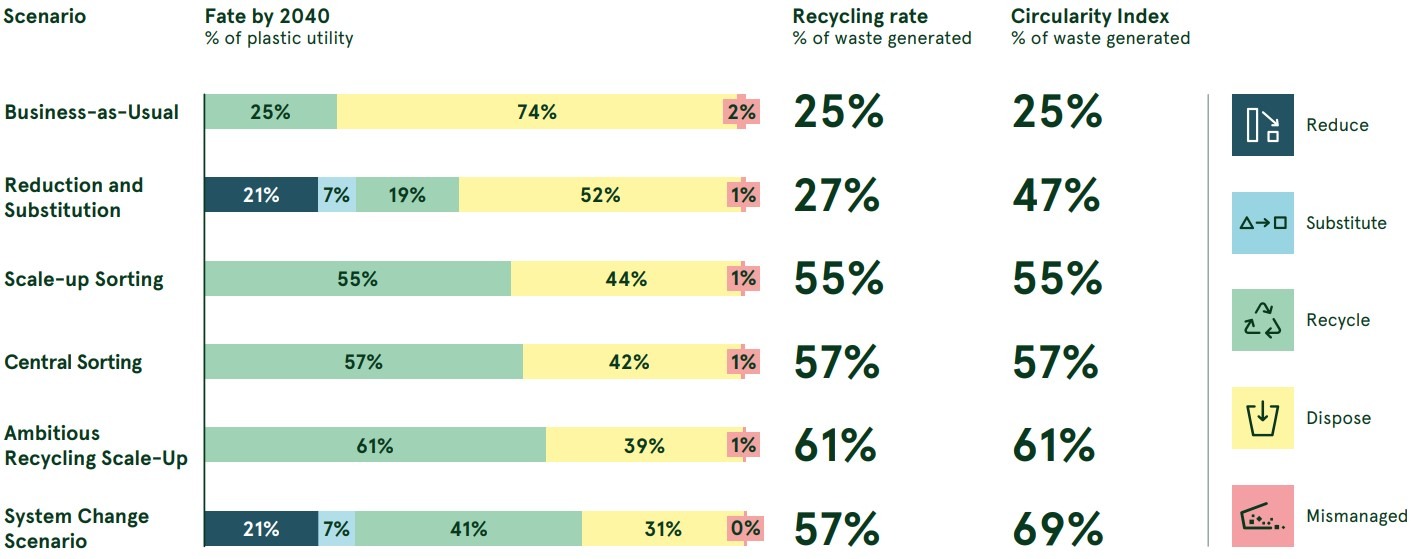
Recycling rates are defined as actually recycled material excluding processing losses. Circularity index is defined as the sum of the reduce, substitute and recycling lever.
EXHIBIT 11
Financial, environmental, and social indicators under different scenarios
THE SYSTEM CHANGE SCENARIO OUTPERORMS OTHER SCENARIOS IN MOST DIMENSIONS THAT MATTER
An approach that works
Dramatically reducing the share of incinerated waste with energy recovery is a complex system-level challenge, but one that is achievable in Norway using existing solutions.
Achieving this outcome requires implementing all 10 synergetic system interventions outlined in Exhibit 12 concurrently, ambitiously, and starting immediately. Importantly, as the system interventions have multiplier effects, implementing them simultaneously yields the greatest impact.
Plus, while innovation and new solutions across every part of the value chain can make the transition better, easier, and faster, the System Change Scenario can achieve all the systemic outcomes outlined in the previous section with existing solutions.
EXHIBIT 12
Ten system interventions are critically needed to achieve the System Change Scenario by 2040
DIFFERENT SYSTEM INTERVENTIONS ARE APPLICABLE TO DIFFERENT PLASTIC CATEGORIES AND DIFFERENT STAKEHOLDER GROUPS

A better plastic system in Norway means relying on more responsible plastic consumption and more responsible plastic waste management. More responsible plastic consumption primarily requires the implementation of upstream solutions, while more responsible plastic waste management requires the implementation of downstream solutions.
Unleashing the upstream: achieving a zero-waste circular plastic economy first requires reducing plastic consumption, substituting materials where it is beneficial, and ensuring all remaining plastic products are designed for recycling
EXHIBIT 13
Opportunity to reduce and substitute plastic under the System Change Scenario
THE CURRENT GROWTH PATTERNS IN PLASTIC CONSUMPTION CAN BE REVERSED THROUGH REDUCTION AND SUBSTITUTION LEVERS
‘000 metric tonnes
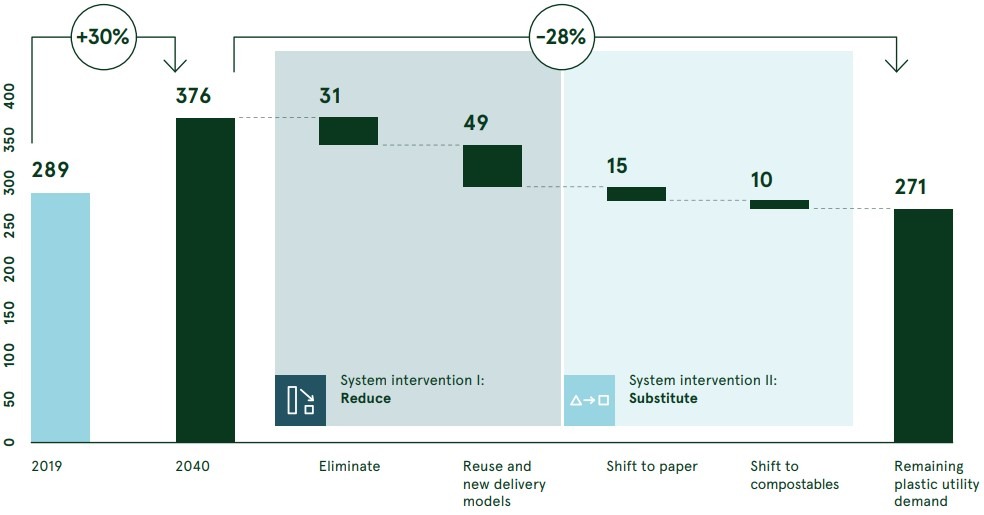
This figure shows plastic utility demand (in other words, plastic waste generated under BAU) in 2019, 2040, and in 2040 after the Reduce and Substitute levers are applied. The respective per cent of plastic waste in 2040 that is reduced by each lever is 8 per cent, 13 per cent, 4 per cent and 3 per cent for a total reduction of 106,000 tonnes or 28 per cent of projected 2040 utility demand.