Chapter 2
A circularity approach
can change the trajectory
System interventions and aggregate results
Our System Change Scenario includes five system intervention wedges aimed at reaching higher circularity levels, and models the most important environmental, social and economic implications of applying a different combination of these interventions to each sector, depending on its specific needs and system impacts.
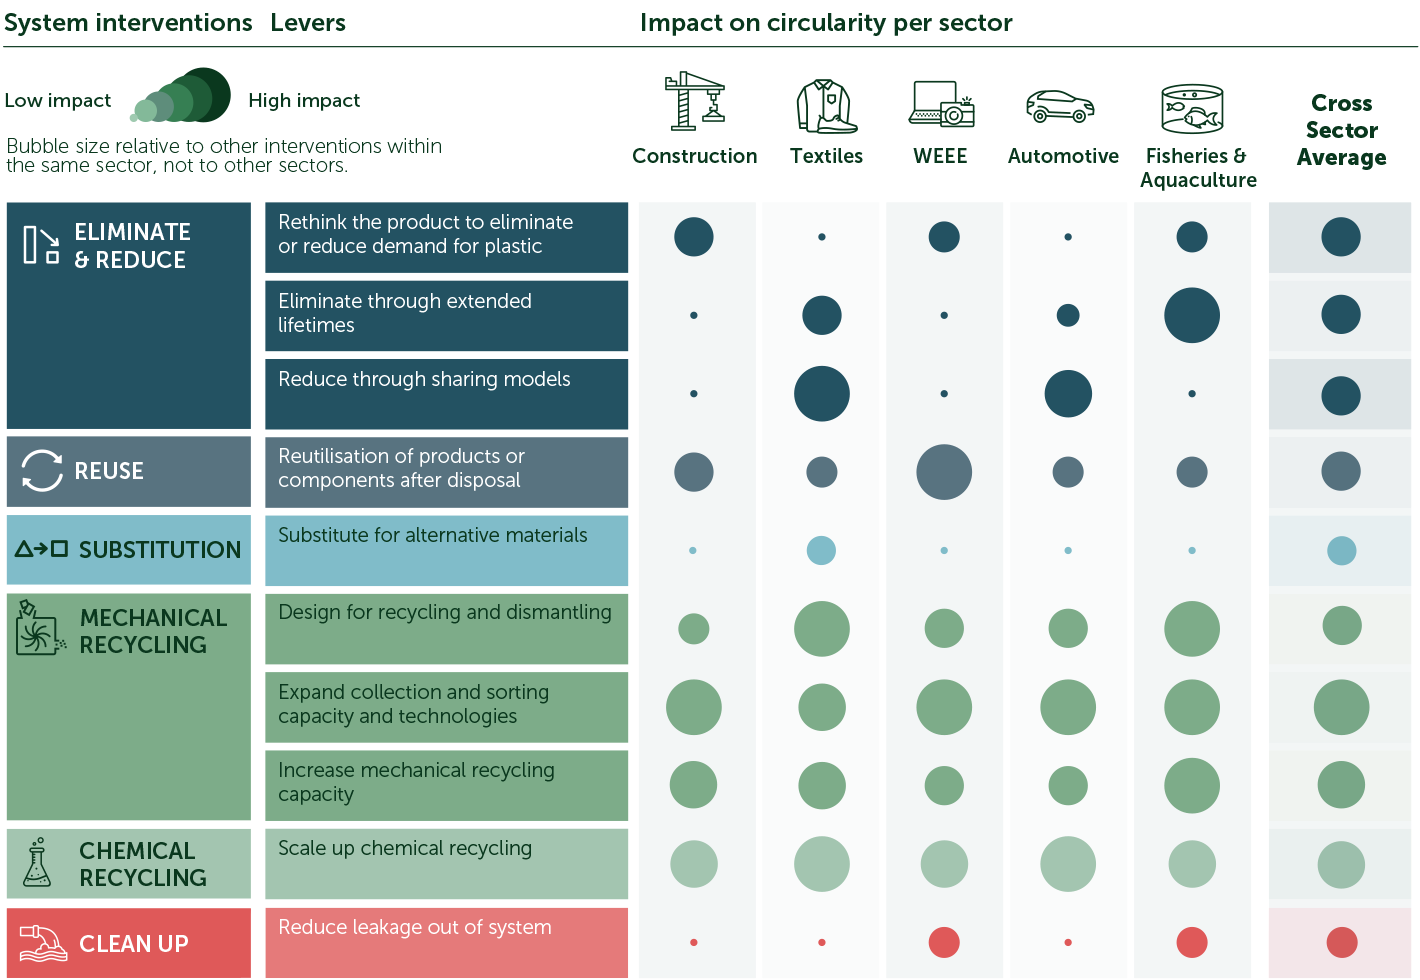
Through the application of ten circularity levers (see Exhibit 6), the five sectors can achieve ~77% circularity levels by 2040 while eliminating ~28% of demand for virgin plastic and reducing GHG emissions by 38% (Exhibit 7). This is not in line with Norway’s GHG reduction targets, hence the need for the Net-Zero Scenario presented in the next chapter. The predominant circularity pathway is mechanical recycling (~34%), followed by reduction (~20%), chemical recycling (~16%) and reuse/repair (~6%).
Chemical recycling and its application in Norway
Chemical recycling is a nascent technology and the capacities of the different technologies beyond 2030 are highly uncertain.
Allocation assumptions for the Norwegian market overall, and for each sector, were made considering European capacity projections for each technology (pyrolysis, gasification, dissolution, and depolymerisation) and the availability of quality waste streams and polymer types in Norway.
EXHIBIT 6
System interventions and corresponding levers improve circularity in the sectors with varying levels of applicability
“A System Change Scenario can change the trajectory, reducing GHG emissions by 38% compared to 2020, while reducing the amount of net capex.”
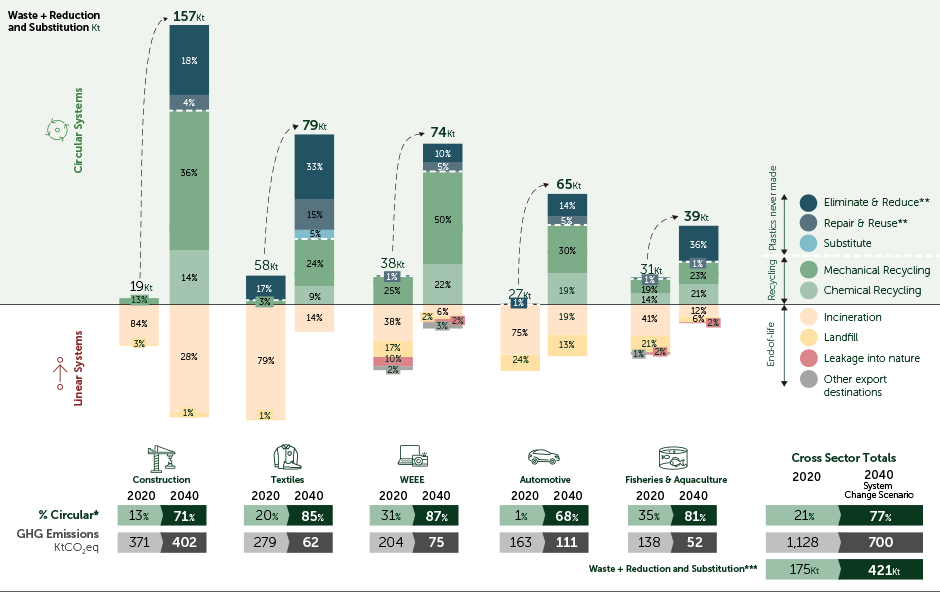
Although incineration and landfill can be reduced both in proportion and absolute terms by 2040 (except for the Construction sector), these still represent ~18% and ~3% of the end-of-life destinations for plastic (vs ~63% and ~12% in 2020)g.
Construction remains a challenge as incineration and landfill will increase in absolute volume due to waste volumes increasing by a factor of 7. Another attention point is that there will not be enough recyclate available to satisfy the full
voluntary demand for recycled content in either Construction or Fisheries & Aquaculture by 2040, meaning that flows of recycling will balance out based on market supply and demand.
The System Change Scenario reduces the amount of net capex required to build the system by around NOK 700,000 compared to scaling up the linear system infrastructure. Resource efficiency is coupled with capital efficiency as plastic utility is decoupled from plastic volume.
Around 50% of the investment is used to scale recycling, equally divided between mechanical and chemical, while 35% is used to scale up production capabilities and another ~10% to scale up incineration. Total jobs in the plastic system remain the same between the System Change Scenario in 2040 and the Baseline Scenario in 2020.
EXHIBIT 7
In a System Change Scenario circularity can increase from 21% to 77% and incineration can be significantly reduced, except for Construction
2020 vs System Change Scenario 2040

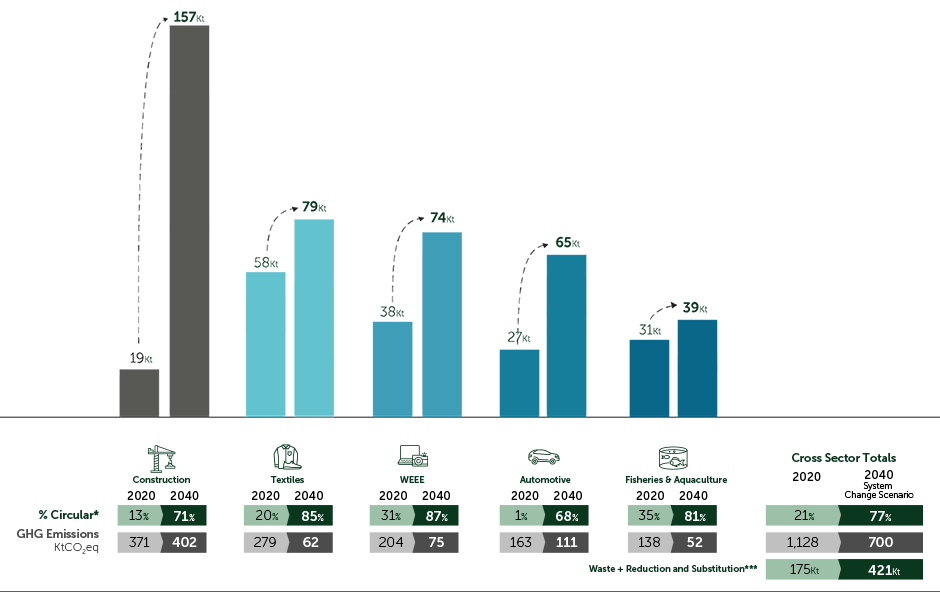


*Circularity as a % of annual demand for plastic utility corrected for net addition to stock
**Reduction: elimination through dematerialisation & lifetime extension, and reduction through new delivery models enabling access. Reuse: reutilisation of products or components after disposal
***Waste includes: repair & reuse, recycling, incineration, landfill, leakage and other expert destinations
Sectors in scope
Please continue to the next page to learn more about the report’s sector specific insights. Alternatively, skip to the sector most relevant to your interests…